 IGUANIFY
5 Minute Weekly Episodic Analytics for Shorts Creators

Episodic analytics for Shorts means tracking how one episode’s performance predicts the next, not just how each Short does alone. The core metric is the episode-to-episode retention proxy: Episode N+1 views divided by Episode N views, measured at the same post-age. Start there. YouTube Studio won’t calculate it for you, but a spreadsheet and five minutes a week will.
TL;DR:
- Tracking episode-to-episode retention proxies (views of N+1 divided by N at the same post-age) reveals viewer drop-off patterns in Shorts series.
- Consistent naming, playlist grouping, and referral tracking are crucial for accurate episode-level analytics and boosting suggested-video traffic.
- Most retention issues originate in the first 3 to 5 seconds, with a weak hook causing sharp early drop-offs that require immediate fix.
- Weekly routine of collecting, calculating, flagging, diagnosing, and acting on metrics keeps series performance aligned and improvement targeted.
- Using third-party tools becomes necessary for managing multiple series or longer runs, especially for identifying exit points and cross-platform performance.
Table of Contents
- What Episodic Analytics for Shorts Actually Measures
- Key Shorts Metrics Every Episodic Creator Must Track
- How to Build Episode-Level Metrics When the Platform Doesn’t Provide Them
- Diagnosing Drop-Offs: Reading Retention Curves and Fixing What’s Broken
- Weekly Measurement Workflow and KPIs for Episodic Shorts
- When to Use Third-Party Tools and What Each Category Solves
- Where to Find Shorts Analytics in YouTube Studio
- Best Practices for Structuring Episodic Shorts to Maximize Retention
- Techniques for Integrating Narrative Elements in Short-Form Episodic Content
- Strategies to Promote Shorts Episodes Across Platforms
- Reading Audience Demographic Data for Episodic Optimization
- Publisher Perspective: Aligning Production and Analytics for Faster Iteration
- An Alternative Approach: Simplifying Testing and Tracking
- Sources
What Episodic Analytics for Shorts Actually Measures
Single-video analytics tell you if a Short worked. Episodic analytics for shorts tells you if your series is working, which is a different question entirely. A Short can be popular individually and still fail as a series if very few viewers ever find Episode 2.
That distinction gets lost because YouTube Studio, by design, reports on individual videos. It’s genuinely good at that job. The Shorts chip in the Content tab surfaces views, impressions, click-through rate, average view duration, watch time, subscriber change, and a retention curve for every Short you post. Buffer’s creator guide to Shorts analytics walks through exactly where each of these lives on desktop and mobile.
What none of it does natively is connect Episode 3 to Episode 4. That’s the gap episodic analytics fills, and it’s the gap the rest of this guide is built to close.
Key Shorts Metrics Every Episodic Creator Must Track
Not every number in YouTube Studio deserves equal attention. Some are hard facts. Others are directional signals you should read as proxies, not gospel.
- Views — raw reach; useful for spotting demand spikes but says nothing about quality.
- Impressions and impressions CTR — how often YouTube showed your thumbnail and how many people clicked; a weak CTR usually means the thumbnail or title, not the episode content, is the problem.
- Average view duration and completion rate — your clearest signal on hook and pacing strength.
- Watch time — feeds discoverability algorithms more than any single metric on this list.
- Subscriber change (per video) — episodic series often convert subscribers on episode 2 or 3, not episode 1, so track this per episode rather than in aggregate.
- Retention curve — shows exactly where viewers exit, second by second.
- Traffic sources — reveals whether suggested-video placement is pushing viewers from one episode into the next.
- Remixes, likes, comments — engagement signals, weaker predictors of series health but useful for gut-checking creative direction.
Treat views, impressions CTR, and the retention curve as your reliable core three. Everything else adds color, but those three tell you whether an episode is discoverable, whether the hook lands, and whether the cliffhanger actually pulled people forward. One important guardrail: compare Shorts only to other Shorts, never to your long-form catalog. The behavior patterns don’t transfer.
How to Build Episode-Level Metrics When the Platform Doesn’t Provide Them
YouTube Studio has no episode-to-episode retention tracker and no binge detector. It was never built to think in series, so creators have to build that layer themselves. The good news: the proxy math is simple enough to run in a five-minute weekly check.
- Calculate the retention proxy. Divide Episode N+1 views by Episode N views, both measured at the same post-age (say, 48 hours after publish). If Episode 4 has significantly more views at 48 hours than Episode 5 at the same time point, your proxy indicates viewer drop-off. Values below half for consecutive episodes merit investigation. A notably low retention proxy across multiple episodes is worth investigating.
- Check suggested-video referrals. In the traffic sources tab, look for how much of an episode’s traffic came from “suggested videos.” A rising suggested-video share pointing from Episode N to N+1 is one of the better available signals for actual sequential viewing.
- Clean up naming and playlist structure. Number episodes in titles (“Ep. 4”), use one consistent hashtag per series, and group episodes in a playlist. Sloppy naming makes suggested-video matching weaker and your own tracking harder.
- Log it in a spreadsheet with five columns: Episode #, Views at 48h, Views at 7d, Retention Proxy (N+1/N), Suggested-Video Referral %.
Pro Tip: Measure the retention proxy at the same post-age every time. Comparing a 48-hour snapshot of Episode 5 against a 7-day snapshot of Episode 4 will give you a number that looks alarming and means nothing.
Diagnosing Drop-Offs: Reading Retention Curves and Fixing What’s Broken
The first 3 to 5 seconds decide most of a Short’s fate. Top-performing Shorts typically hold above 70% retention through that opening window and keep average retention above 50% across the full runtime. If your curve falls off a cliff before second five, the problem is almost never pacing further into the video. It’s the hook.
Different drop-off shapes point to different fixes:
- Sharp drop in the first 3 seconds — weak or unclear hook; rewrite the opening line or reshoot the first shot.
- Steady bleed through the middle — pacing drag; cut dead air and tighten transitions.
- Drop right before the end — the cliffhanger isn’t landing, or the payoff feels unearned.
- Low CTR but strong retention once clicked — the content is fine; the thumbnail or title is the leak.
For hook and CTR problems, run a title/thumbnail swap: change one variable, publish, and compare impressions CTR after 48 hours against your series average. Frame-level retention tools can flag the exact second viewers leave, which means you re-edit five seconds of footage instead of re-shooting the whole episode. That’s the difference between a ten-minute fix and a lost afternoon. For a deeper benchmark comparison, Iguanify’s audience retention guide for Shorts breaks down typical retention shapes by episode position.
Weekly Measurement Workflow and KPIs for Episodic Shorts
Analytics only help if you check them on a schedule, not in a panic three weeks after a series stalls. A five-step weekly routine keeps the noise manageable:
- Collect. Pull views, average view duration, and impressions CTR for every episode published in the last two weeks.
- Calculate. Update your retention proxy (Episode N+1 ÷ Episode N) for the newest pair.
- Flag. Mark any episode where the proxy drops below 50% or CTR falls more than 20% under your series average.
- Diagnose. Pull the retention curve on flagged episodes and match the drop-off shape to a likely cause.
- Act. Make one change (thumbnail, hook, pacing edit) and re-test on the next episode.
Match your KPI to an appropriate lookback window: use a short window to judge initial demand, a medium window to evaluate retention and episode proxy, and a longer window to identify lifetime patterns like slow-burn discovery through search or suggested videos. A series that limps out of the gate but climbs steadily at 28 days is a different problem than one that spikes and dies. Iguanify’s posting schedule research shows how cadence itself affects which of these windows matters most.
When to Use Third-Party Tools and What Each Category Solves
Spreadsheets handle episode-level proxies fine at small scale. Once a series runs long, or you’re managing several shows at once, the manual math starts costing more time than it saves.
- Per-second retention analyzers flag the exact timestamp viewers exit, useful when your Studio retention curve shows a drop but doesn’t tell you why.
- Cross-platform aggregators normalize watch time, completion, and engagement across YouTube, TikTok, and Instagram so you’re not manually reconciling three different reporting formats, since each platform’s API reports these metrics differently.
- Episode-series dashboards automate the N+1 ÷ N proxy calculation across an entire catalog instead of one pair at a time.
- URL-tracking for CTAs measures whether pinned comments or end-screen links actually move viewers to the next episode.
Adopt a tool when you’re publishing more than two episodes a week, running a series longer than ten episodes, or managing more than one show without a dedicated analytics person. Below that threshold, the spreadsheet method covers most of what you need.
Where to Find Shorts Analytics in YouTube Studio
On desktop, open YouTube Studio and click Content in the left sidebar. A row of chips sits above your video list: All, Videos, Shorts, Live, and Posts. Click Shorts, and the list filters to only your vertical episodes, each with quick-glance views and publish date.
Click into any individual Short and you land on its Analytics tab, split into Overview, Reach, Engagement, and Audience. Overview shows views, watch time, and subscriber change at a glance. Reach shows impressions, impressions CTR, and traffic sources, including that suggested-video slice you need for the binge proxy. Engagement holds the retention curve, along with likes, comments, and remixes. This tabbed structure exists because YouTube separated content-specific analytics so creators could see Shorts performance without long-form videos muddying the picture.
On mobile, the YouTube Studio app compresses this into fewer taps but keeps the same data: tap Analytics from your channel dashboard, then filter by content type. The retention curve renders a bit smaller on a phone screen, which makes desktop the better choice when you’re diagnosing a specific drop-off rather than doing a quick weekly check. Bookmark both. You’ll use mobile for fast Monday glances and desktop for the deeper Wednesday retention audit.
Best Practices for Structuring Episodic Shorts to Maximize Retention
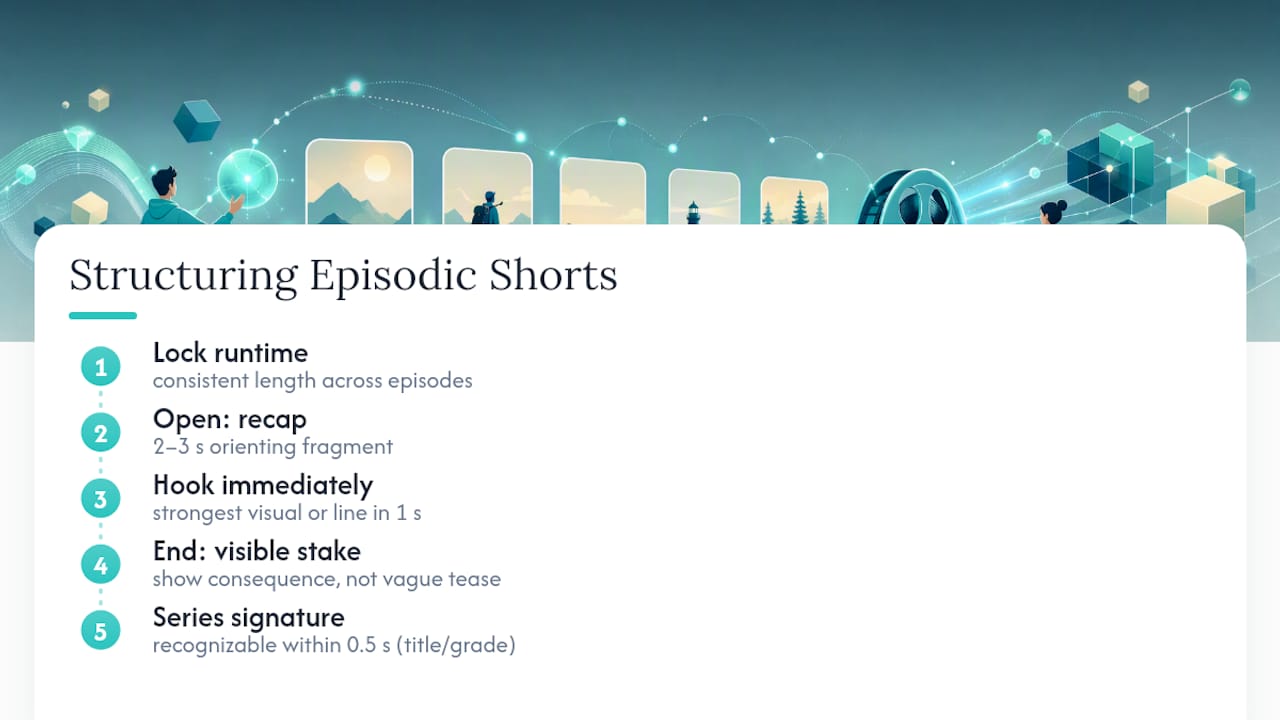
Structure decisions made before you publish Episode 1 do more for retention than any edit you’ll make after the fact. Consistent runtime across episodes matters more than most creators assume. If Episode 1 runs 45 seconds and Episode 6 runs 90, viewers can’t calibrate expectations, and your retention curve becomes harder to read because you’re comparing different formats, not different quality levels. Iguanify’s episode length research is worth reviewing before you lock a runtime for the whole series.
Open every episode with a recap fragment, no more than 2 to 3 seconds, that orients returning viewers without boring first-time viewers into an early drop-off. Put the strongest visual or line of dialogue in the first second, not after a logo or title card.
End on a specific, visible stake, not a vague “find out next time.” A cliffhanger that shows the consequence (a character opening a door, a phone buzzing with a name on screen) outperforms one that only implies it. Keep a consistent visual signature, a title card style, a recurring transition, a color grade, so viewers recognize the series in their feed within half a second, before they’ve even read the caption.
Techniques for Integrating Narrative Elements in Short-Form Episodic Content
Traditional TV pacing doesn’t survive the transplant to a 60-second format. You don’t have room for a three-act structure; you have room for one turn and one hook. The most reliable narrative technique for episodic Shorts is the “mid-scene cut”: start the episode already inside the action, never with setup, and end mid-tension rather than at a natural pause.
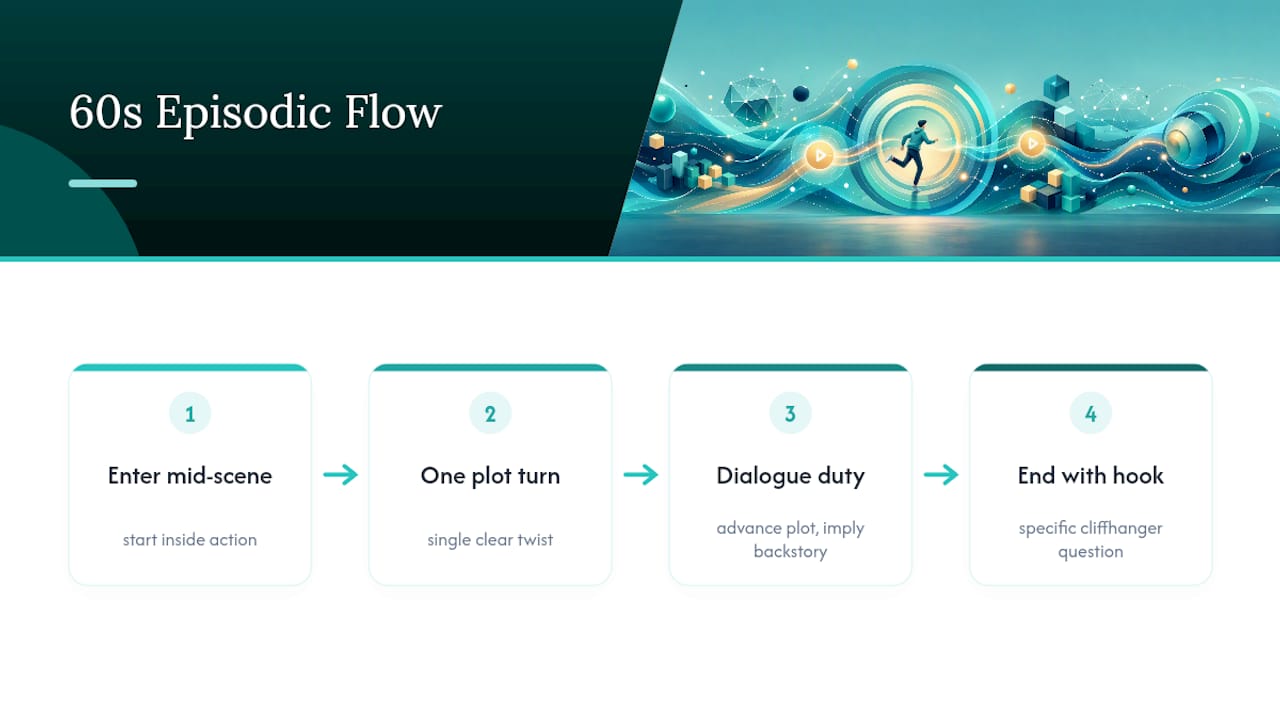
Dialogue should do double duty, advancing plot while implying backstory, since you rarely get a scene to spare for pure exposition. A single well-placed line (“You said you’d never come back here”) tells the viewer there’s history without spending five seconds explaining it.
Cliffhangers work best when they raise a specific question rather than a general one. “What happens next?” is weak. “Will she recognize him?” is strong, because it gives the viewer something concrete to return for, and you can measure whether it worked by checking whether Episode N+1’s suggested-video referral share climbs. Character consistency across episodes, same face, same voice, same visual tells, reduces the cognitive load viewers need to re-enter your story each time, which is part of why continuity problems in AI-generated video hurt episodic series more than standalone content.
Strategies to Promote Shorts Episodes Across Platforms
A strong episode doesn’t discover itself. Cross-posting to TikTok and Instagram Reels multiplies your at-bats, but only if you adapt the presentation, not just the file. Add a platform-native caption style rather than reusing the same text across all three; each platform’s audience reads captions differently, and your click-through rate reflects that.
Pin a comment on YouTube that names the episode number and links to the next one or the playlist. That single habit, done consistently, is one of the cheapest ways to lift suggested-video and direct-navigation traffic between episodes. On TikTok, use the same series hashtag every time, without exception, since inconsistent tagging breaks discovery far more than most creators expect.
Cross-promote inside your own catalog: reference Episode 3 in Episode 4’s caption, and vice versa, so algorithms and human viewers both get a trail to follow. If you’re running the same series on TikTok and YouTube simultaneously, Iguanify’s guide to publishing a TikTok series covers the naming and sequencing habits that keep both platforms’ recommendation systems pointed at your next episode instead of a competitor’s.
Reading Audience Demographic Data for Episodic Optimization
The Audience tab in YouTube Studio breaks viewers down by age, gender, geography, and when they’re online, and for an episodic series, this data means more than it does for standalone content. A series skewing heavily toward one age band tells you which cultural references and pacing choices are landing; a series with a wide, flat age spread often signals the hook is generic enough to work but not sharp enough to build a dedicated audience.
Watch the “returning viewers” proportion inside the Audience tab closely. It’s the closest native signal YouTube gives you to actual binge behavior, since it reports what share of an episode’s audience previously watched something else on your channel. A rising returning-viewer share across your last five episodes is a stronger series-health signal than any single episode’s raw view count.
Geography and time-of-day data should shape your publishing schedule, not just your content. Cross-reference demographic shifts against episode content changes. If a wardrobe change, tone shift, or new character coincides with an audience skew, that’s a causal thread worth testing deliberately rather than dismissing as noise.
Publisher Perspective: Aligning Production and Analytics for Faster Iteration
Analytics only work if the thing you’re measuring stays consistent. Swap actors, change the visual style, or drift the episode format every few installments, and your retention proxy stops measuring story quality. It starts measuring noise. Consistent characters and format are what make episode-over-episode comparison mean anything at all, which is exactly the problem Iguanify was built to remove from episodic production. When output is automated and continuity holds, the loop between “we found a weak cliffhanger” and “we tested a stronger one” gets a lot shorter.
— Leonard
An Alternative Approach: Simplifying Testing and Tracking
Every diagnostic in this guide assumes you can re-test fast. That’s the hard part for most solo creators, who lose days to editing before they ever get to compare a new hook against the old one. Some platforms aim to solve that gap: a single line of script becomes a finished, vertically formatted episode, with the same characters carrying through the whole series, so your Episode N+1 ÷ Episode N proxy actually measures story quality instead of production drift.
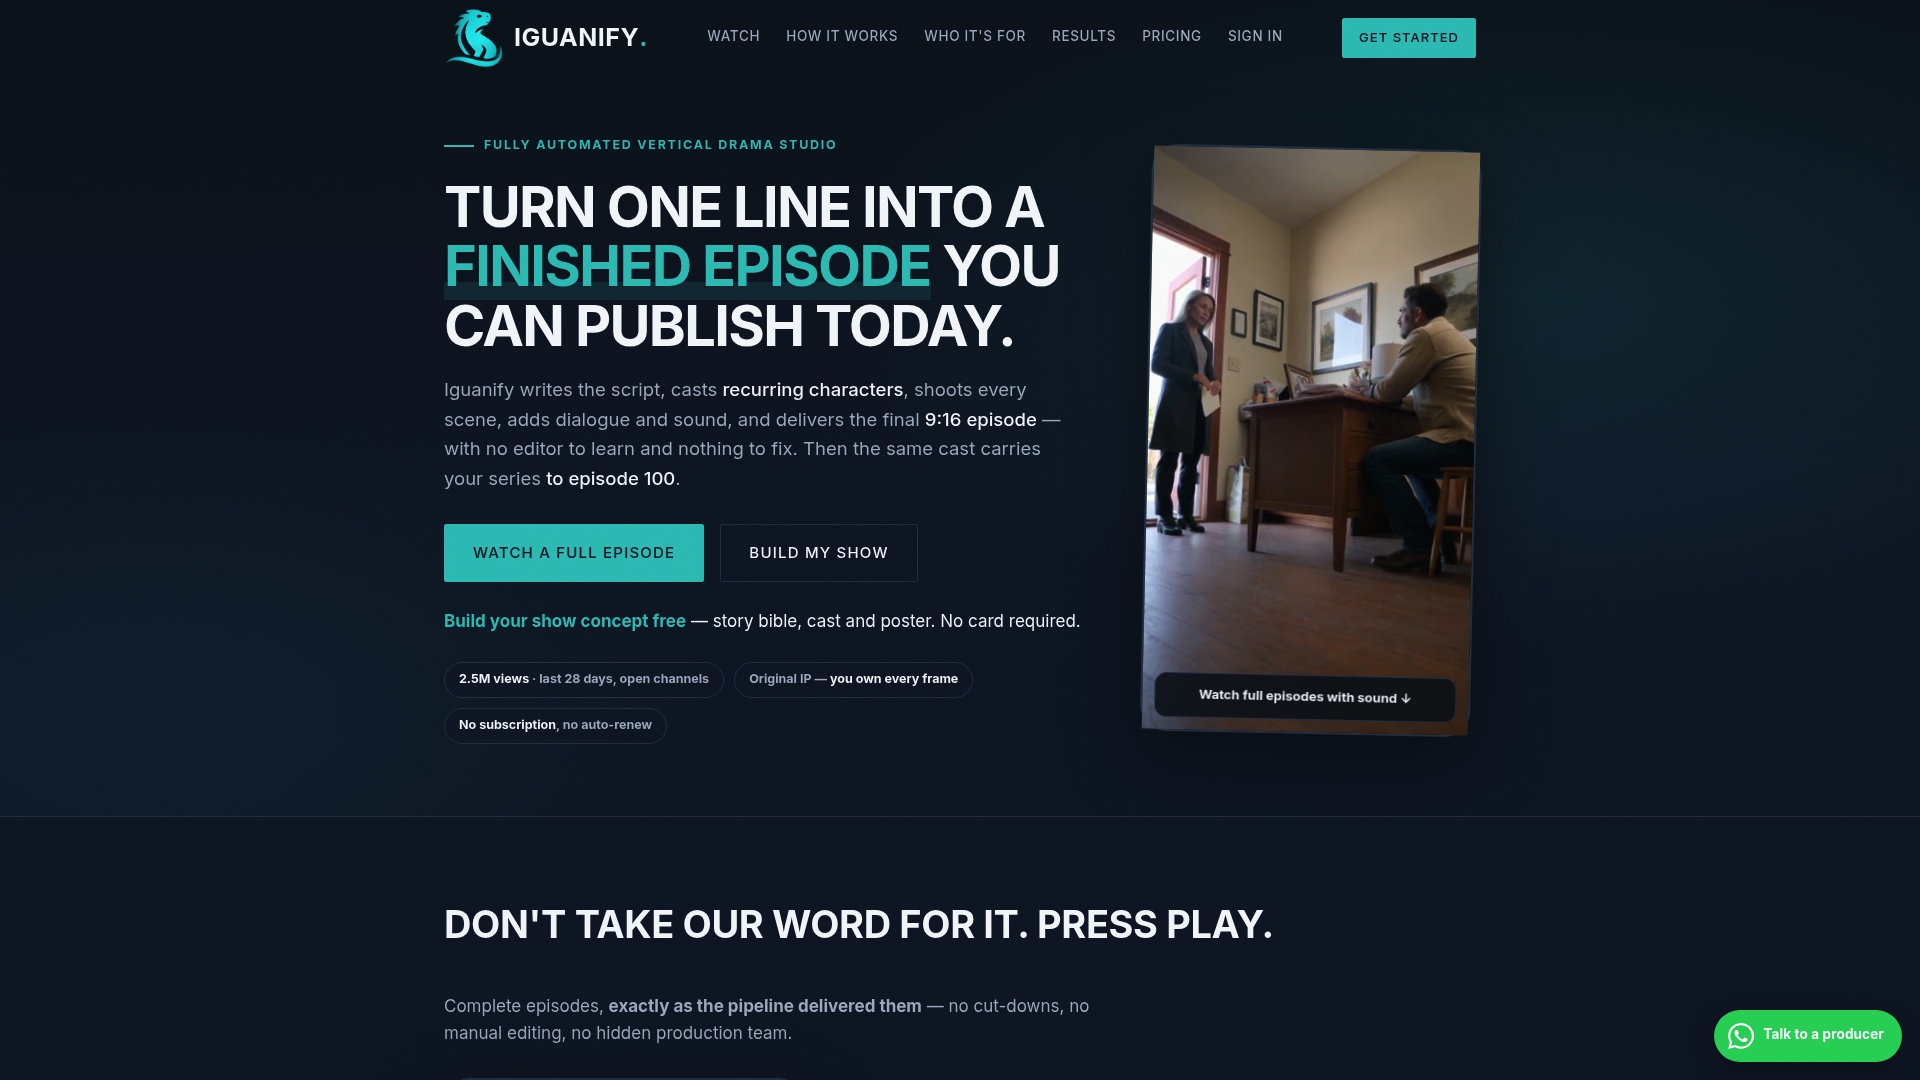
Because episodes come out consistently formatted and ready to publish, naming and playlist hygiene stop being manual chores; you get clean, trackable episode numbering by default across multiple platforms. That consistency is what makes the A/B tests in this guide, swapping a hook, tightening a cliffhanger, run in days rather than weeks, since there’s no production team schedule to work around. Users also keep full rights to the content they produce. If you’re ready to see how a scripted premise becomes a trackable episode, start with the AI drama generator and generate your first episode concept free before deciding on a production option.
Sources
Start with YouTube’s own Shorts analytics documentation and Iguanify’s monetization guide for revenue context alongside your retention data.
- Content tab analytics tips - Shorts - YouTube Help
- How to Track YouTube Shorts Series Performance (Step-by-Step) | Reelytics
- YouTube Shorts Retention Analysis – Second-by-Second | Shorta
- YouTube Shorts Analytics & Analysis Tool - Retensis